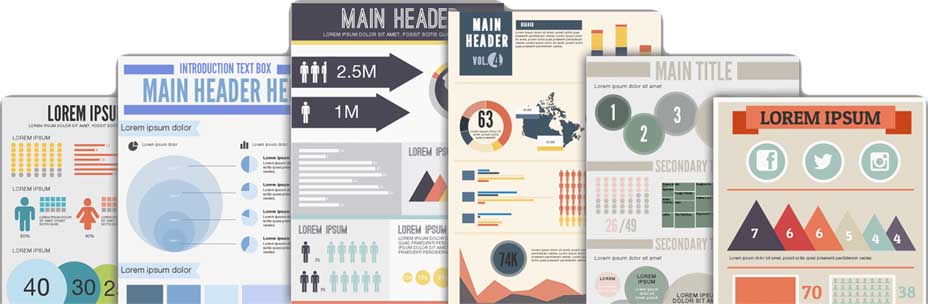
A simple word given to the visual representations of data which turns it into information, and leading us to Information graphics or more likely said Infographics. Talking about internet users, or simply talking about many generations altogether, feel free to get captured by the clicks drawn from messages which are although small but efficient at colors, shine and brightness and it possible attracts the attention. What they display if the token of the information.
When you see a simple data traversed all through the graphics and become a perfect vision for your knowledge. The perfect visibility of statistics bars, picture which quench your thirst for information in the most colorful way. It adds more visibility, more attractions and at last more viewers.
Enthrall yourself with this amazing range of tools to enhance what people see in your work. Here are some of the best and free online tools for creating infographics templates.
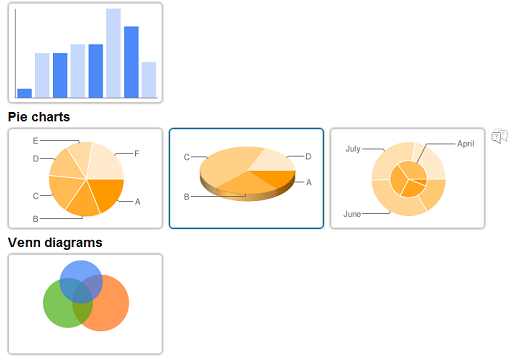
In love to flaunt charts for the statistics online, and then go for Hohli, chart maker. Create Venn Diagrams, many types of charts, scatter plots portraying information you enter. It sets you to choose titles, have data points and picture different backgrounds for graphic. Do the work of comparisons, data presentations and process description with customized appearances.
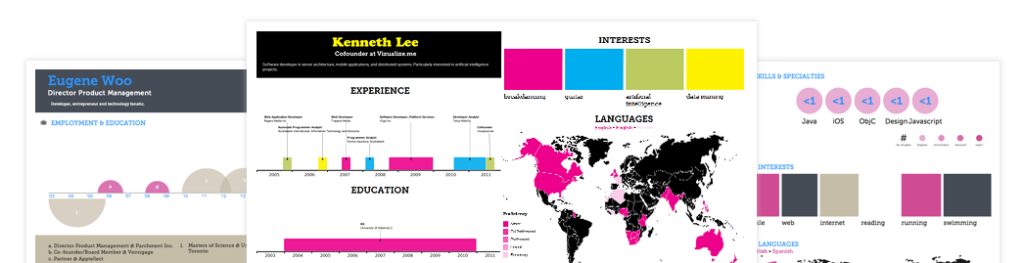
You can make the infographics for your resume with this novel app. It usually works by utilizing the information of user present at LinkedIn profile. Make a kickass visual resume with the help of this tool and engrave smartly into the business world.
Want to have easy access and wish to complete the task in less time, then here is the game.
Easily create professional diagrams, flow charts and purpose based diagrams via this tool. It lets you even collaborate with your team mates. Huge collection of purpose-designed diagram offers you opportunity to add data and make customized data. It is paid via monthly subscription fees along with free public account access.
It perfectly helps you to customize Infographics and all that it required to use it your imagination and knowing the reason to want something. Make perfect Infographics with Visually Create. It also let you know the trends in Infographics and which are rated top by other users.
Offering plethora of free templates which can used to create our own Infographics. It comes with monthly subscription as well. It provides easy way to scratch the right thing out by being an ultimate SEO asset, which plays pretty fine with marketing strategy. Better search engine scrolling the Infographics as well, pay for the personalized outputs. Experience endless themes, vectors, icons, and images.
Have the fun way to create the infographics with the enchanting feature of drag and drop along with simple interface. It also supports you create and share as well the visual ideas online by “vhemes”. Just drag and drop the idea on to your canvas turning it into a full infographics.
Get custom made infographics online for free with the help of this tool. It helps you in publishing too. This at the same time engages the viewers to track result. You can create beautiful infographics for your website and blogs to be published.
Infogr.am is a very simple but at the same time very appealing platform to announce new Infographics. It showcases way to create static as well as interactive Infographics. Turn data into absolute and refined state which takes forms of chart or amazing Infographics in few minutes.
A product by IBM Research, lets you browse through, existing sets of data or rather use your own. The public databases efficiently span information about population density across the U.S. & Internet browsers by popularity. Feel free to upload one’s own data set and craft as per your own visualization. Enjoy endless options given by it.
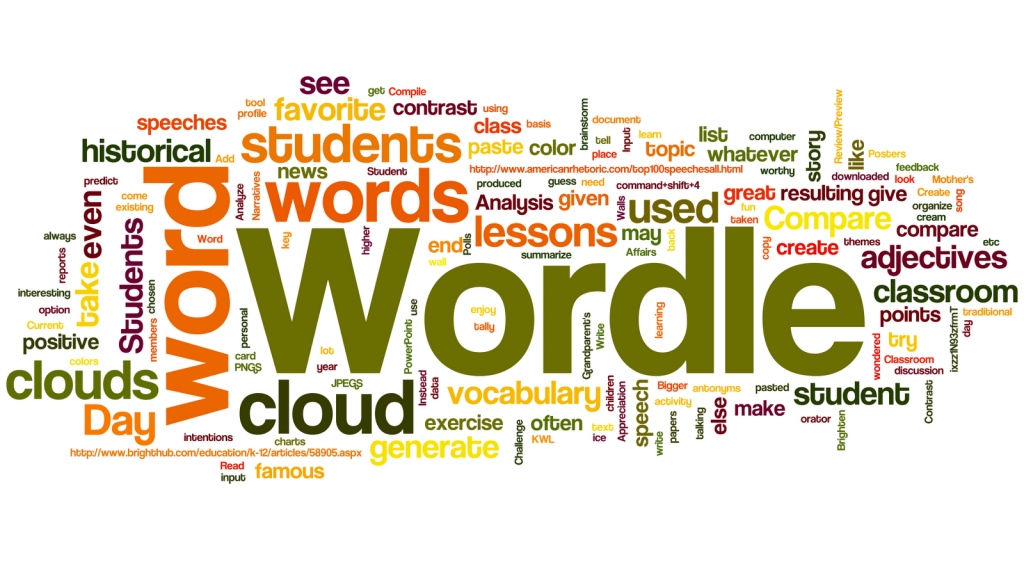
Wordle is a simple yet powerful tool in web world. It sets grounds to generate word clouds from the prescribed texts by you. It shows perfect work by giving better prominence to those words which appear frequently in the given text. Experience whole new world different font, colour schemes and colour schemes
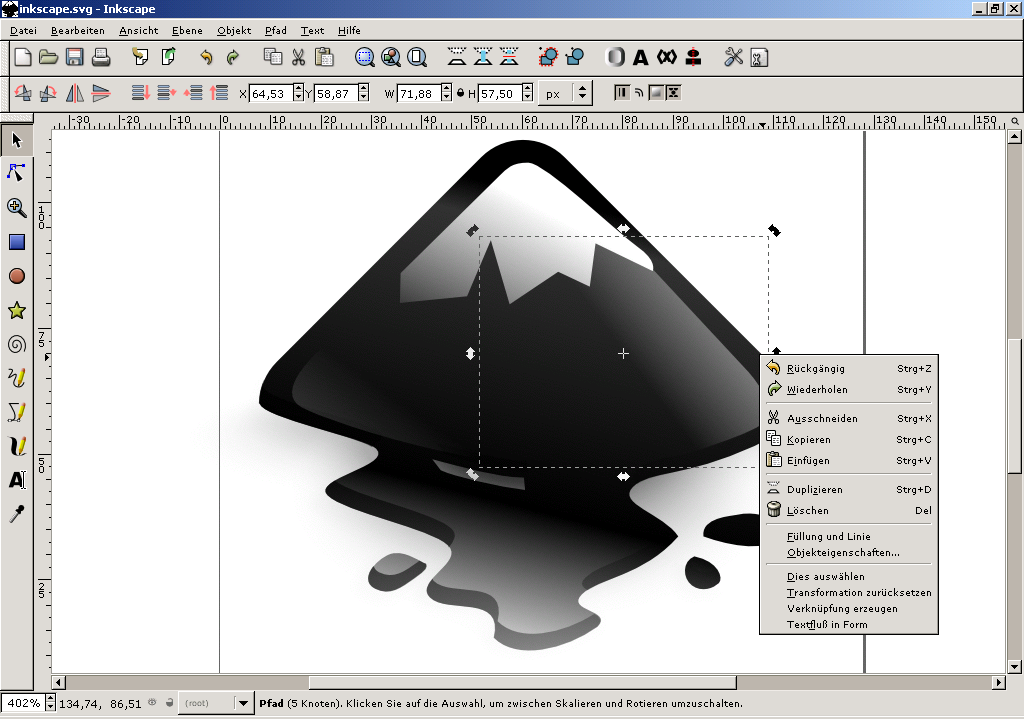
Being an open Source, it is vector graphics editor. It will astonish with amazing features drawing essence from CorelDraw, Illustrator or Xara X. The application provides fine visuals to create a brilliant Infographics without any prior knowledge.
Leave a Reply